
Klima, Lufttemperatur. 2023 in Deutschland.
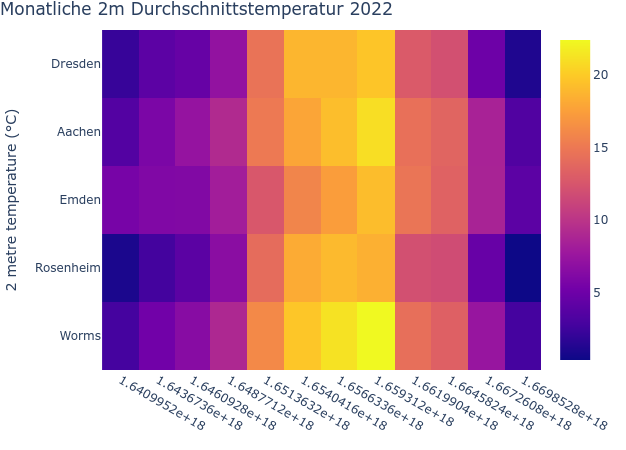
Wärmevergleich monatliche Durchscnittstemperaturen 2022 von Worms, Rosenheim, Aachen, Dresden
Ich möchte mal behaupten in Worms wars am wärmsten
Ein Pythonskript für die Toolbox bei https://cds.climate.copernicus.eu
from collections import OrderedDict
import cdstoolbox as ct

# Define dictionary of cities to extract data from
cities = OrderedDict({
    'Worms': {'lat': 49.6327, 'lon': 8.3591},
    'Rosenheim': {'lat': 47.85637,'lon': 12.1224},
    'Emden': {'lat': 53.36745, 'lon': 7.2077},
    'Aachen': {'lat': 50.7766,'lon':6.08342},
    'Dresden': {'lat': 51.05089,'lon': 13.7383},
})

# Define label, latitude and longitude lists
city_labels = list(cities.keys())
lats = [cities[k]['lat'] for k in cities.keys()]
lons = [cities[k]['lon'] for k in cities.keys()]

# Initialise the application
@ct.application(title='Hitzekarte für deutsche Städte')
# Define a livefigure output for the application
@ct.output.livefigure()
def application():
    """Define a function that extracts monthly average Near Surface Air Temperature for five predefined cities and plot them on a heatmap.

    Application main steps:

    - retrieve temperature gridded data
    - extract data at given locations using ct.observation.interp_from_grid
    - plot data as a heatmap
    """

    # Retrieve monthly average temperature
    data = ct.catalogue.retrieve(
        'reanalysis-era5-single-levels-monthly-means',
        {
            'product_type':'monthly_averaged_reanalysis',
            'variable': '2m_temperature',
            'year':'2023',
            'month':[
                '01','02','03',
                '04','05','06',
                '07','08','09',
                '10','11','12'
            ],
            'time':'00:00',
            'grid':['1', '1']
            }
    )

    # Interpolate data for the defined list of cities
    cities_temperature = ct.observation.interp_from_grid(data, lat=lats, lon=lons)

    # Plot the temperature data for each city as a heatmap with time on the x axis
    fig = ct.chart.heatmap(
        cities_temperature,
        xdim='time',
        yticks = city_labels, # assign the city's name to the y ticks
        layout_kwargs = {
            'title': 'Monatliche Durchschnittstemperatur 2023 in 2m Höhe'
        }
    )

    return fig